Data-Analytics_Iris_Data
Analytics performed on the fisher iris dataset
Average and variance of each feature for the total population and for each class for a normal dataset
| Population | Species Setosa | Species Versicolor | Species Virginica | |
|---|---|---|---|---|
| Sepal length Mean | 5.84 | 5.01 | 5.94 | 6.59 |
| Sepal length Variance | 0.68 | 0.12 | 0.26 | 0.4 |
| Sepal width Mean | 3.06 | 3.43 | 2.77 | 2.97 |
| Sepal width Variance | 0.19 | 0.14 | 0.1 | 0.1 |
| Petal length Mean | 3.76 | 1.46 | 4.26 | 5.55 |
| Petal length Variance | 3.1 | 0.03 | 0.22 | 0.3 |
| Petal width Mean | 1.2 | 0.25 | 1.33 | 2.03 |
| Petal width Variance | 0.58 | 0.01 | 0.04 | 0.07 |
Average and variance of each feature for a noisy dataset
| Population | Species Setosa | Species Versicolor | Species Virginica | |
|---|---|---|---|---|
| Sepal length Mean | 5.86 | 4.96 | 5.97 | 6.61 |
| Sepal length Variance | 0.95 | 0.21 | 0.58 | 0.73 |
| Sepal width Mean | 3.08 | 3.48 | 2.82 | 2.95 |
| Sepal width Variance | 0.95 | 0.21 | 0.6 | 0.73 |
| Petal length Mean | 3.76 | 1.45 | 4.28 | 5.56 |
| Petal length Variance | 3.26 | 0.05 | 0.38 | 0.48 |
| Petal width Mean | 1.22 | 0.24 | 1.32 | 2.09 |
| Petal width Variance | 0.65 | 0.02 | 0.09 | 0.12 |
T-Statistics for normal and noisy datasets
Normal dataset
| Flower Parameter | Species | T-Statistic | P-Value |
|---|---|---|---|
| Sepal length | Setosa | -16.797 | 5.72e-22 |
| Sepal width | 6.914 | 9.0e-09 | |
| Petal length | -93.486 | 6.913e-57 | |
| Petal width | -63.966 | 7.06e-49 | |
| Sepal length | Veriscolor | 1.269 | 2.10e-01 |
| Sepal width | -6.475 | 4.32e-08 | |
| Petal length | 7.554 | 9.24e-10 | |
| Petal width | 4.529 | 3.80e-05 | |
| Sepal length | Virginica | 8.281 | 7.12e-11 |
| Sepal width | -1.827 | 7.38e-02 | |
| Petal length | 22.985 | 6.73e-28 | |
| Petal width | 21.283 | 2.09e-26 |
Noisy dataset
| Flower Parameter | Species | T-Statistic | P-Value |
|---|---|---|---|
| Sepal length | Setosa | -13.233 | 8.49e-18 |
| Sepal width | 5.425 | 1.78e-06 | |
| Petal length | -75.570 | 2.17e-52 | |
| Petal width | -44.837 | 1.92e-41 | |
| Sepal length | Veriscolor | 1.006 | 3.20e-01 |
| Sepal width | -3.798 | 4.02e-04 | |
| Petal length | 5.833 | 4.22e-07 | |
| Petal width | 2.480 | 1.66e-02 | |
| Sepal length | Virginica | 6.119 | 1.54e-07 |
| Sepal width | -2.370 | 2.18e-02 | |
| Petal length | 18.183 | 1.99e-23 | |
| Petal width | 17.840 | 4.49e-23 |
One-way analysis of variation (ANOVA1) analysis for both the original and noisy datasets
Generating F-statistics and p-values for each feature to select the two features that provide the best distinction between the classes. Using Null Hypothesis: Means of all three group (i.e Species are Identical, which means that all species have the same sepal, petal, length and width)
| PCA Parameter | F Statistic | P-Value < Alpha | Null Hypothesis |
|---|---|---|---|
| Sepal Length | 119.265 | True | Reject |
| Sepal Width | 49.160 | True | Reject |
| Petal Length | 1180.161 | True | Reject |
| Petal Width | 960.007 | True | Reject |
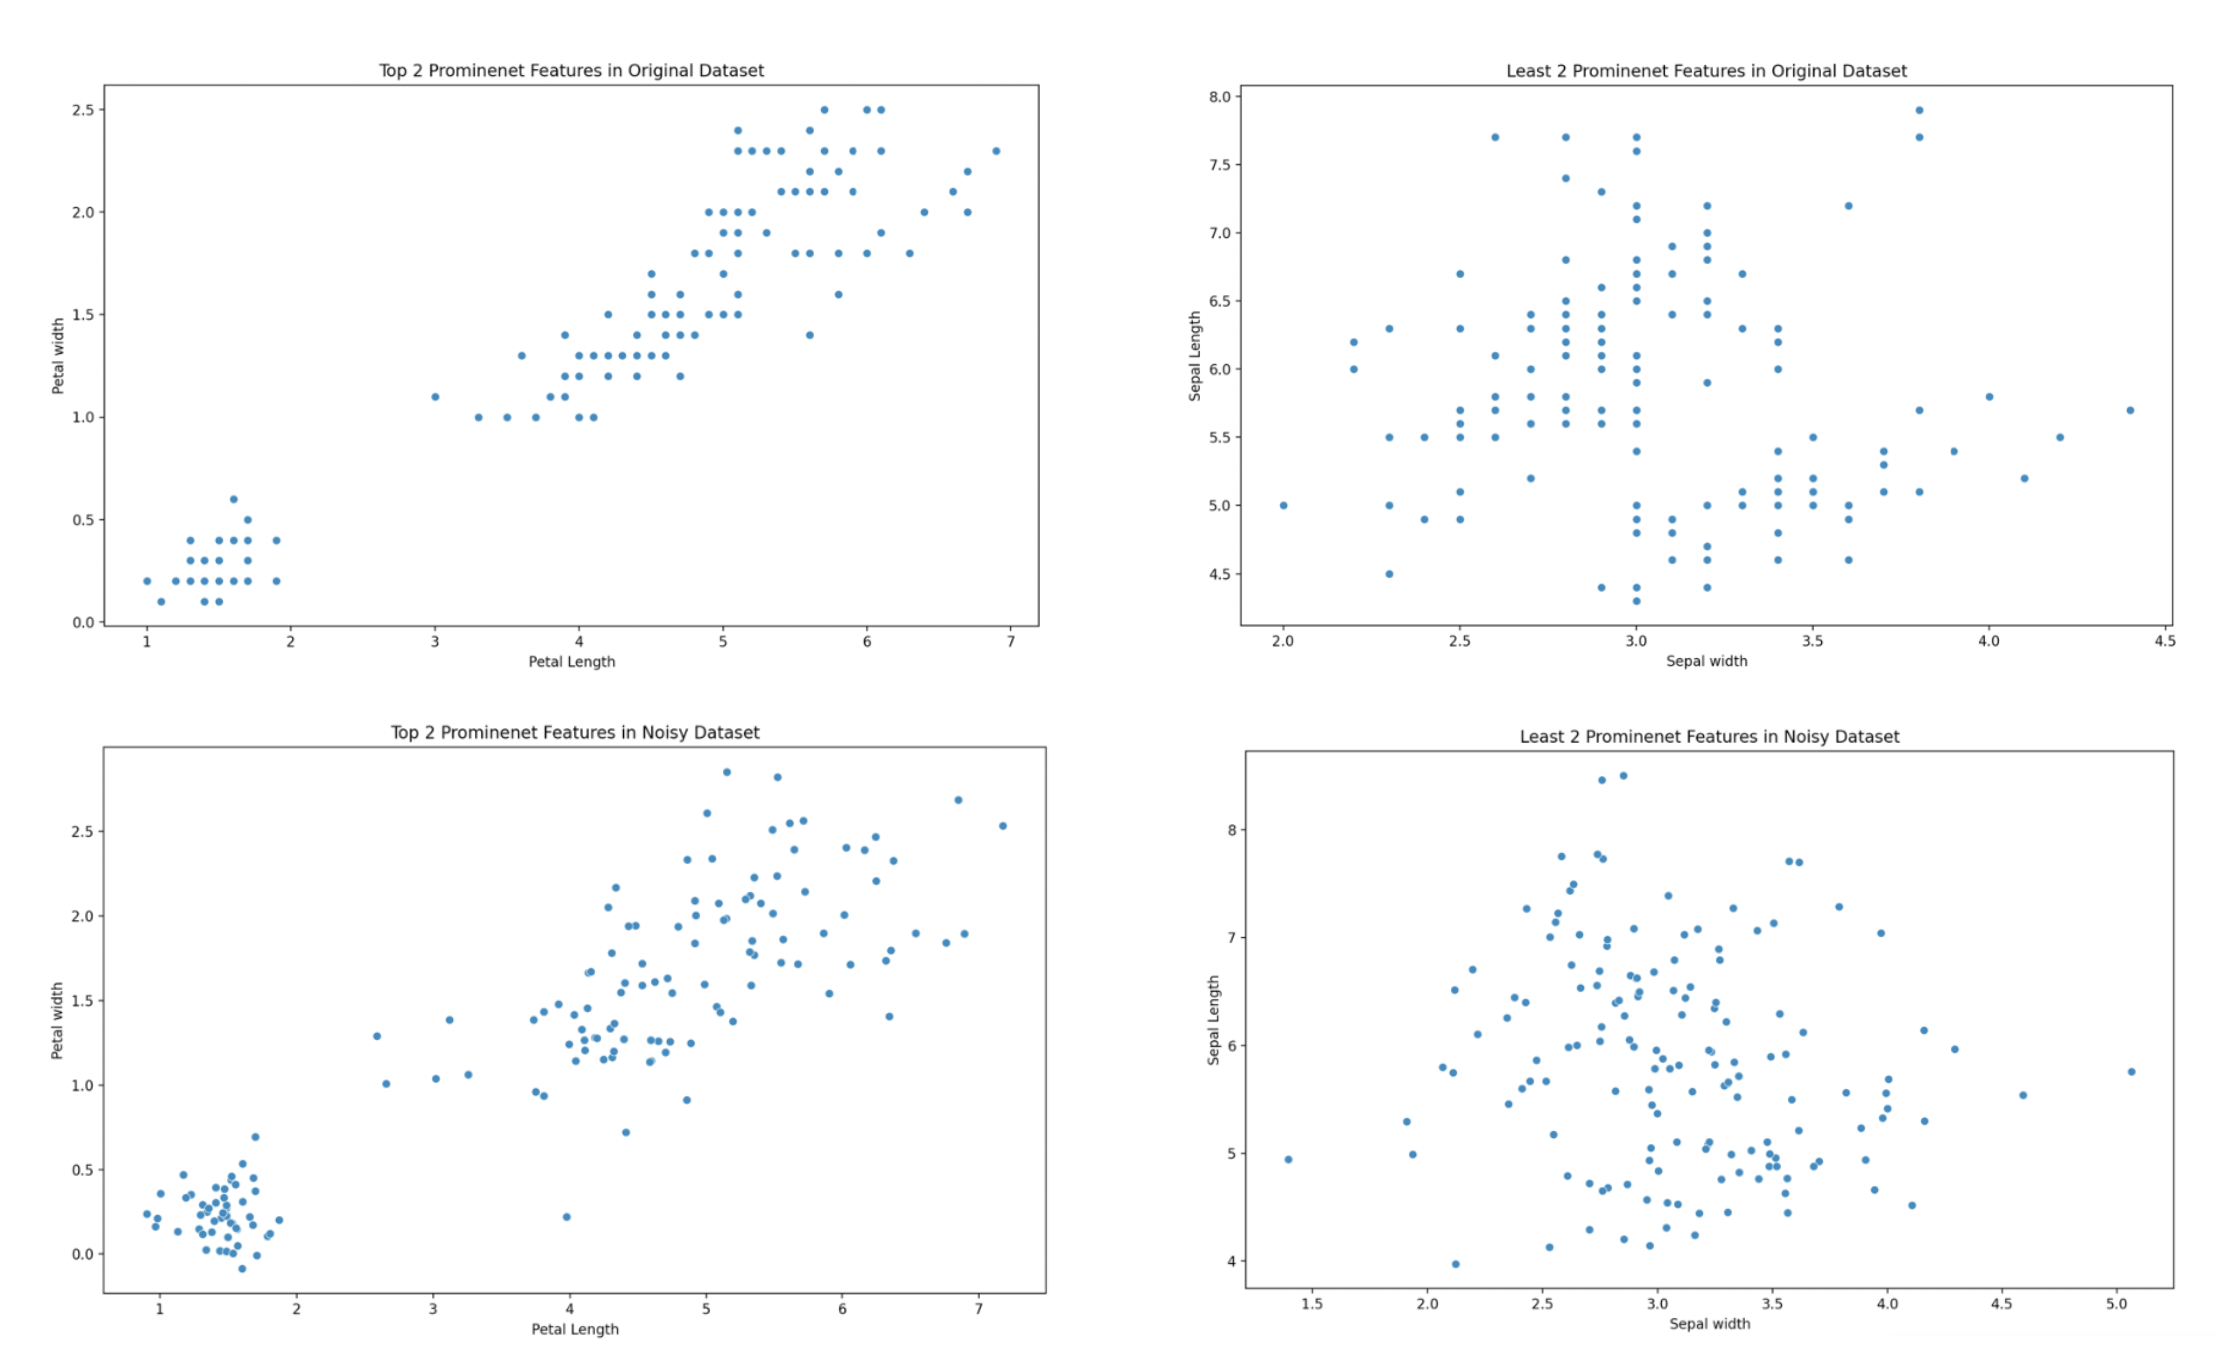
We reject the null hypothesis and accept the alternative hypothesis proven by the F-statistice and p- values. This provides the following most prominent scatter graphs showing the 2 most prominent features being petal length and width and the 2 least prominent features being sepal width and length.
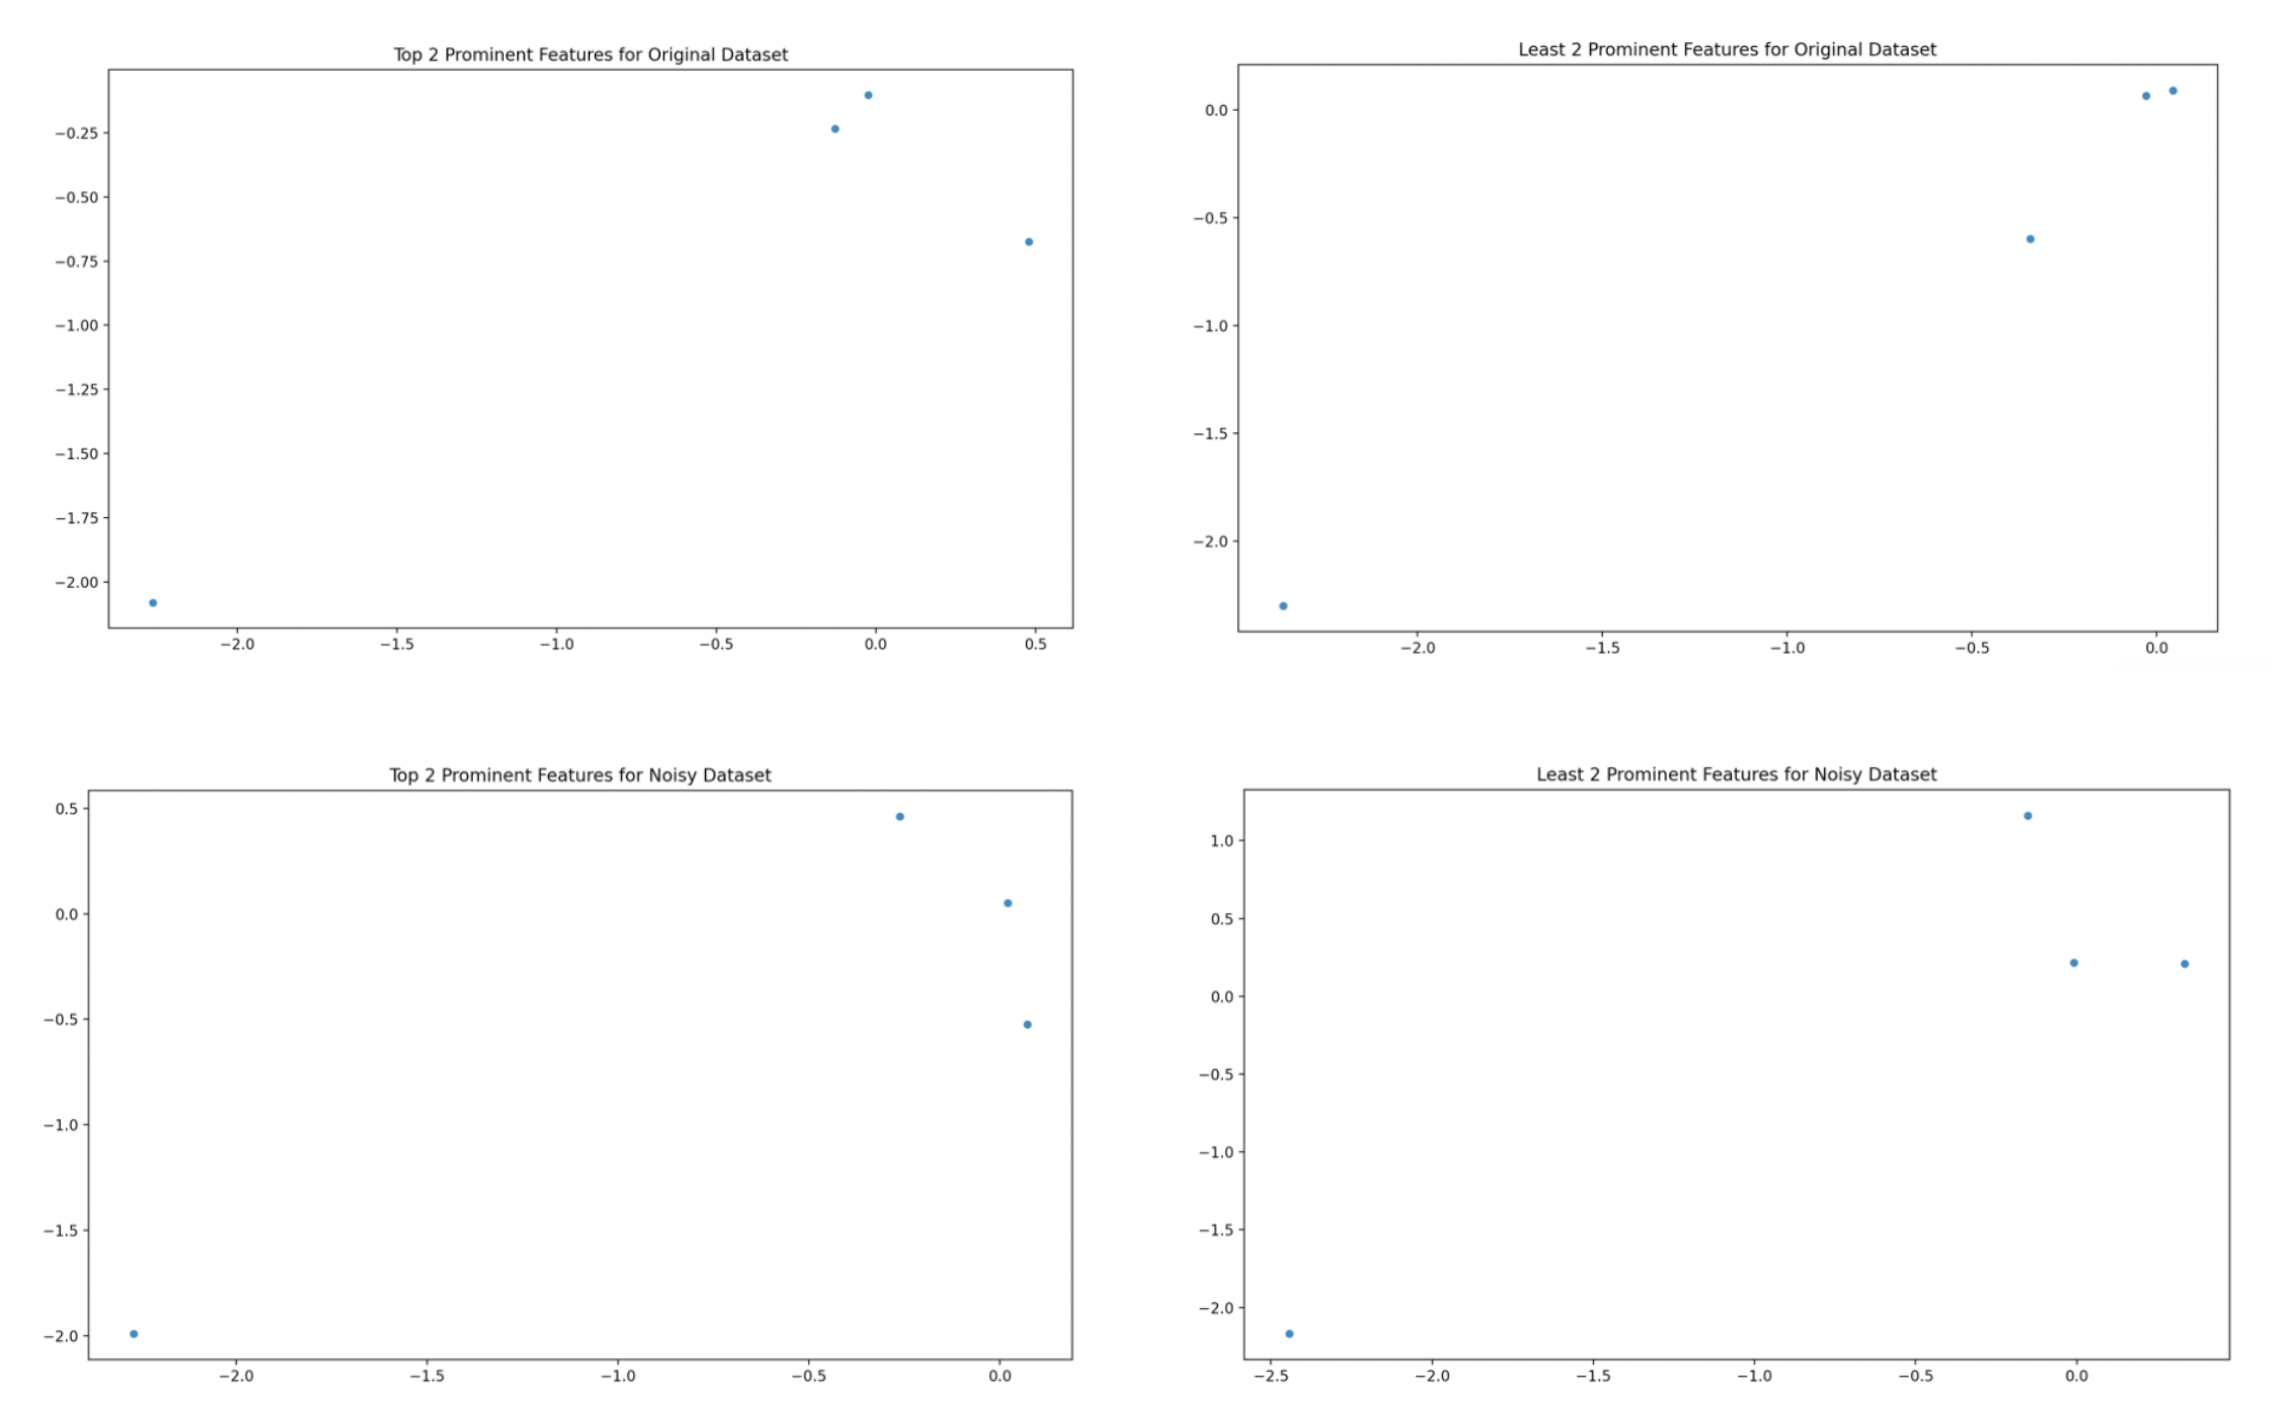
Principal Component Analysis
Determining what fraction of total variance in the set is represented by each principal component. Generate two scatterplots, first of the two most prominent principal components, and then of the two least prominent principal component for the original and noisy datasets in the image below.
| PCA Parameter | Original Variance Fraction | Noisy Variance Fraction |
|---|---|---|
| Sepal Length | 0.730 | 0.675 |
| Sepal Width | 0.229 | 0.225 |
| Petal Length | 0.037 | 0.080 |
| Petal Width | 0.005 | 0.020 |
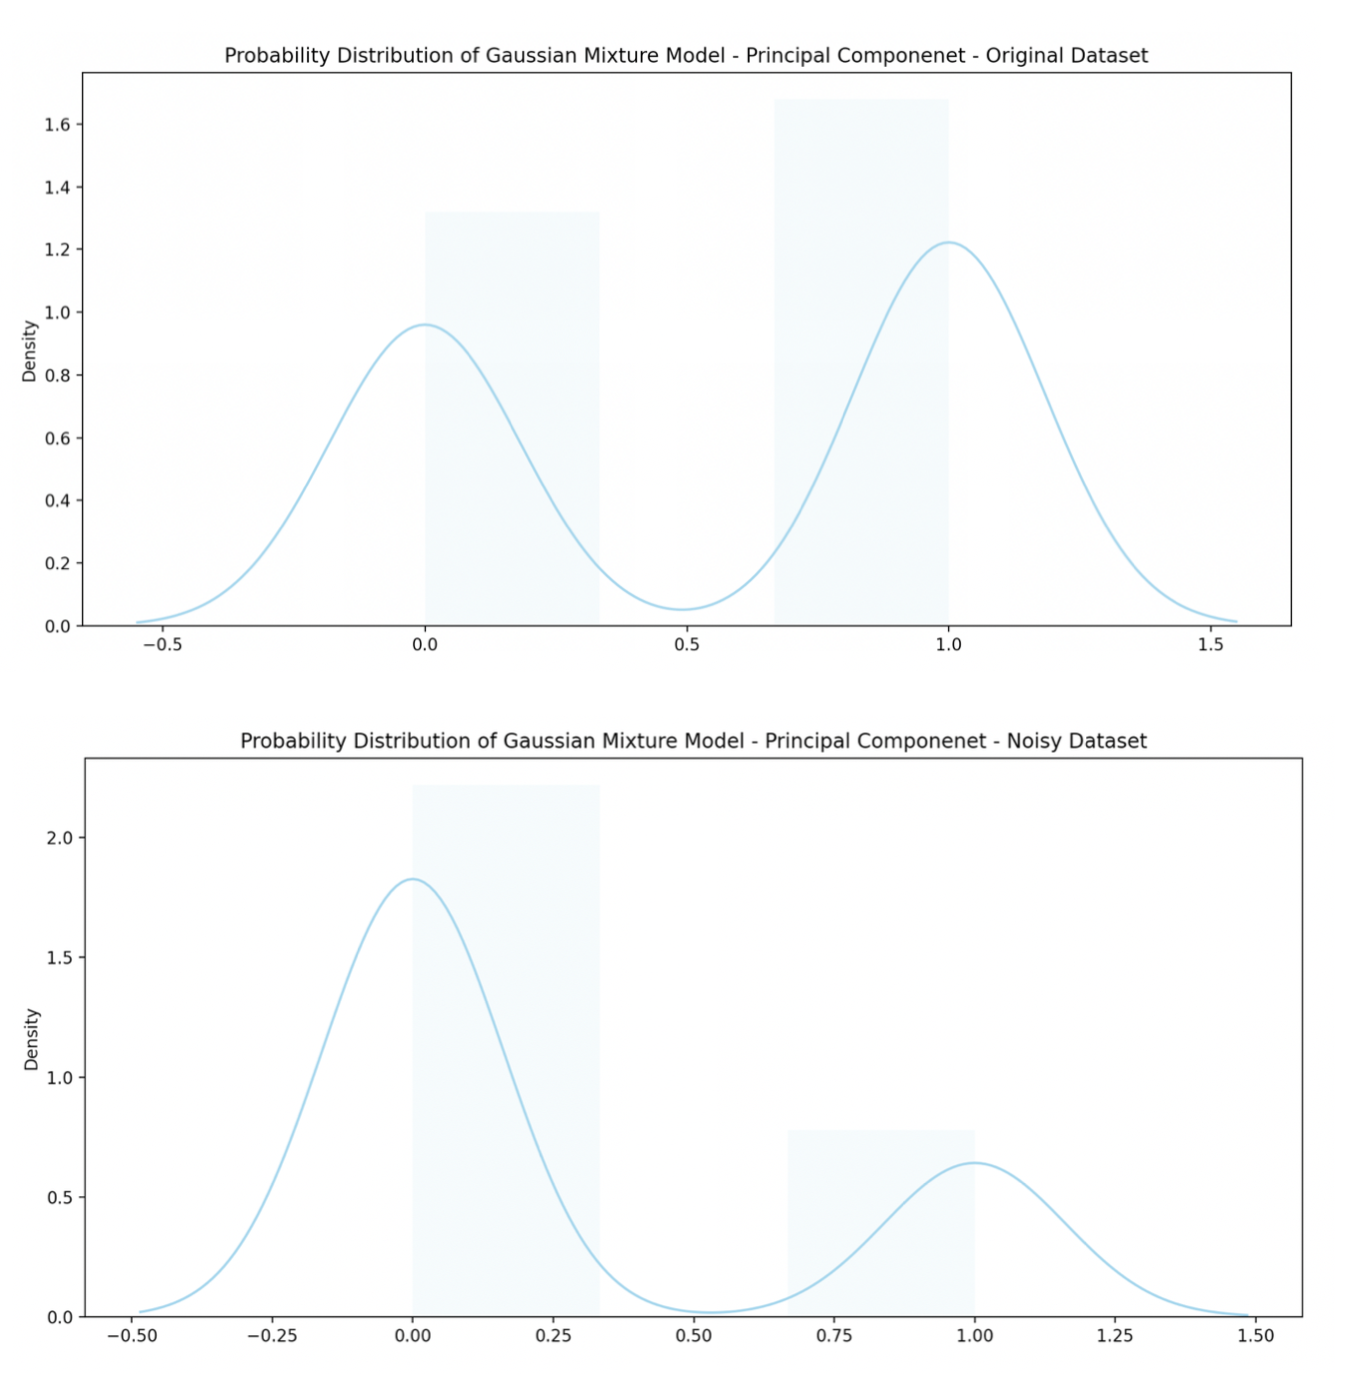
Gaussian Mixture cluster analysis
Using the cores of the two most prominent principal components, the following distributions are found.